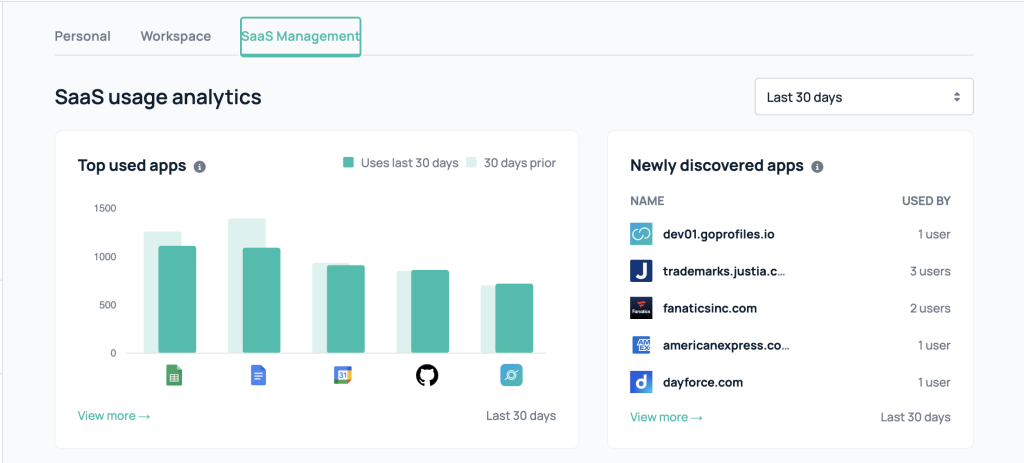
In order to navigate to your GoLinks SaaS Management insight tab, first click the “Analytics” button on the front page of your workspace. Once this is selected, you can then view the SaaS management tab as the third of the three tabs. Select this and the following will be pulled up for viewing. If you do not see these graphs in your version of the product, feel free to contact your customer success manager, or contact support through the chat support or support@golinks.io.
New and Used Apps

The first two segments that will be represented are the top used and newly discovered apps. Each of these can be expanded in order to show you a more detailed view. They can also be updated to view a different date range. If you hover over the charts, you can also see a further detailed breakdown of the chart.
Statistics

The next two segments represented are team statistics, and ROI using go links. Same as before, you can have an expanded view, can change the date range, and you can also hover over the charts in order to get a small breakdown.
Demographics

The final three segments are a breakdown of some demographics. These include device usage, browser type, and location. These can help to see what the usage preferences are for your users, and to understand the areas that see the most success.


